Condition Monitoring

Purpose
Store any data on the NOA Bus to an Influx database for further analysis. The Condition Monitoring app bundles Influx and Grafana as local apps.
The resulting visualization may be embedded in an HELIO HMI.
Follow the instructions below to set up local Condition Monitoring.
Overview
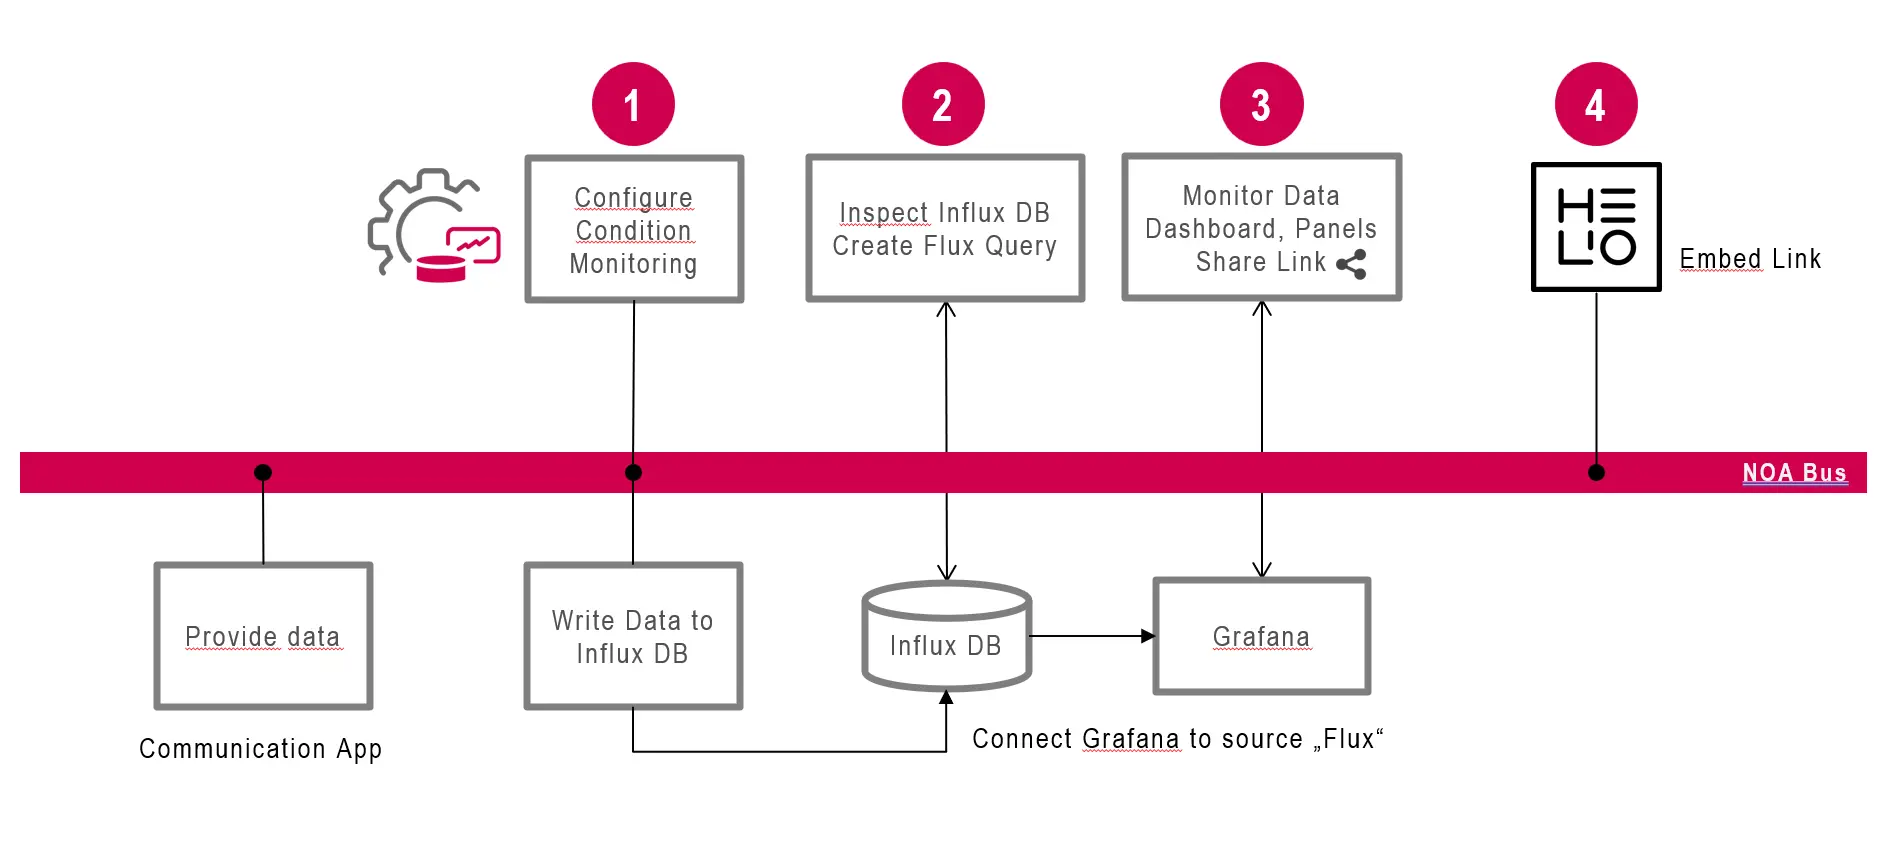
- Configure Data Collection
- Configure Influx Database
- Build Dashboard in Grafana
- Embed in HMI (optional)
Condition Monitoring usess the following open-source tools (in parentheses the default username and password)
- Influx Time series database: (
admin/password) - Grafana for Dashboards and Data visualization (
admin/admin)
Anatomy
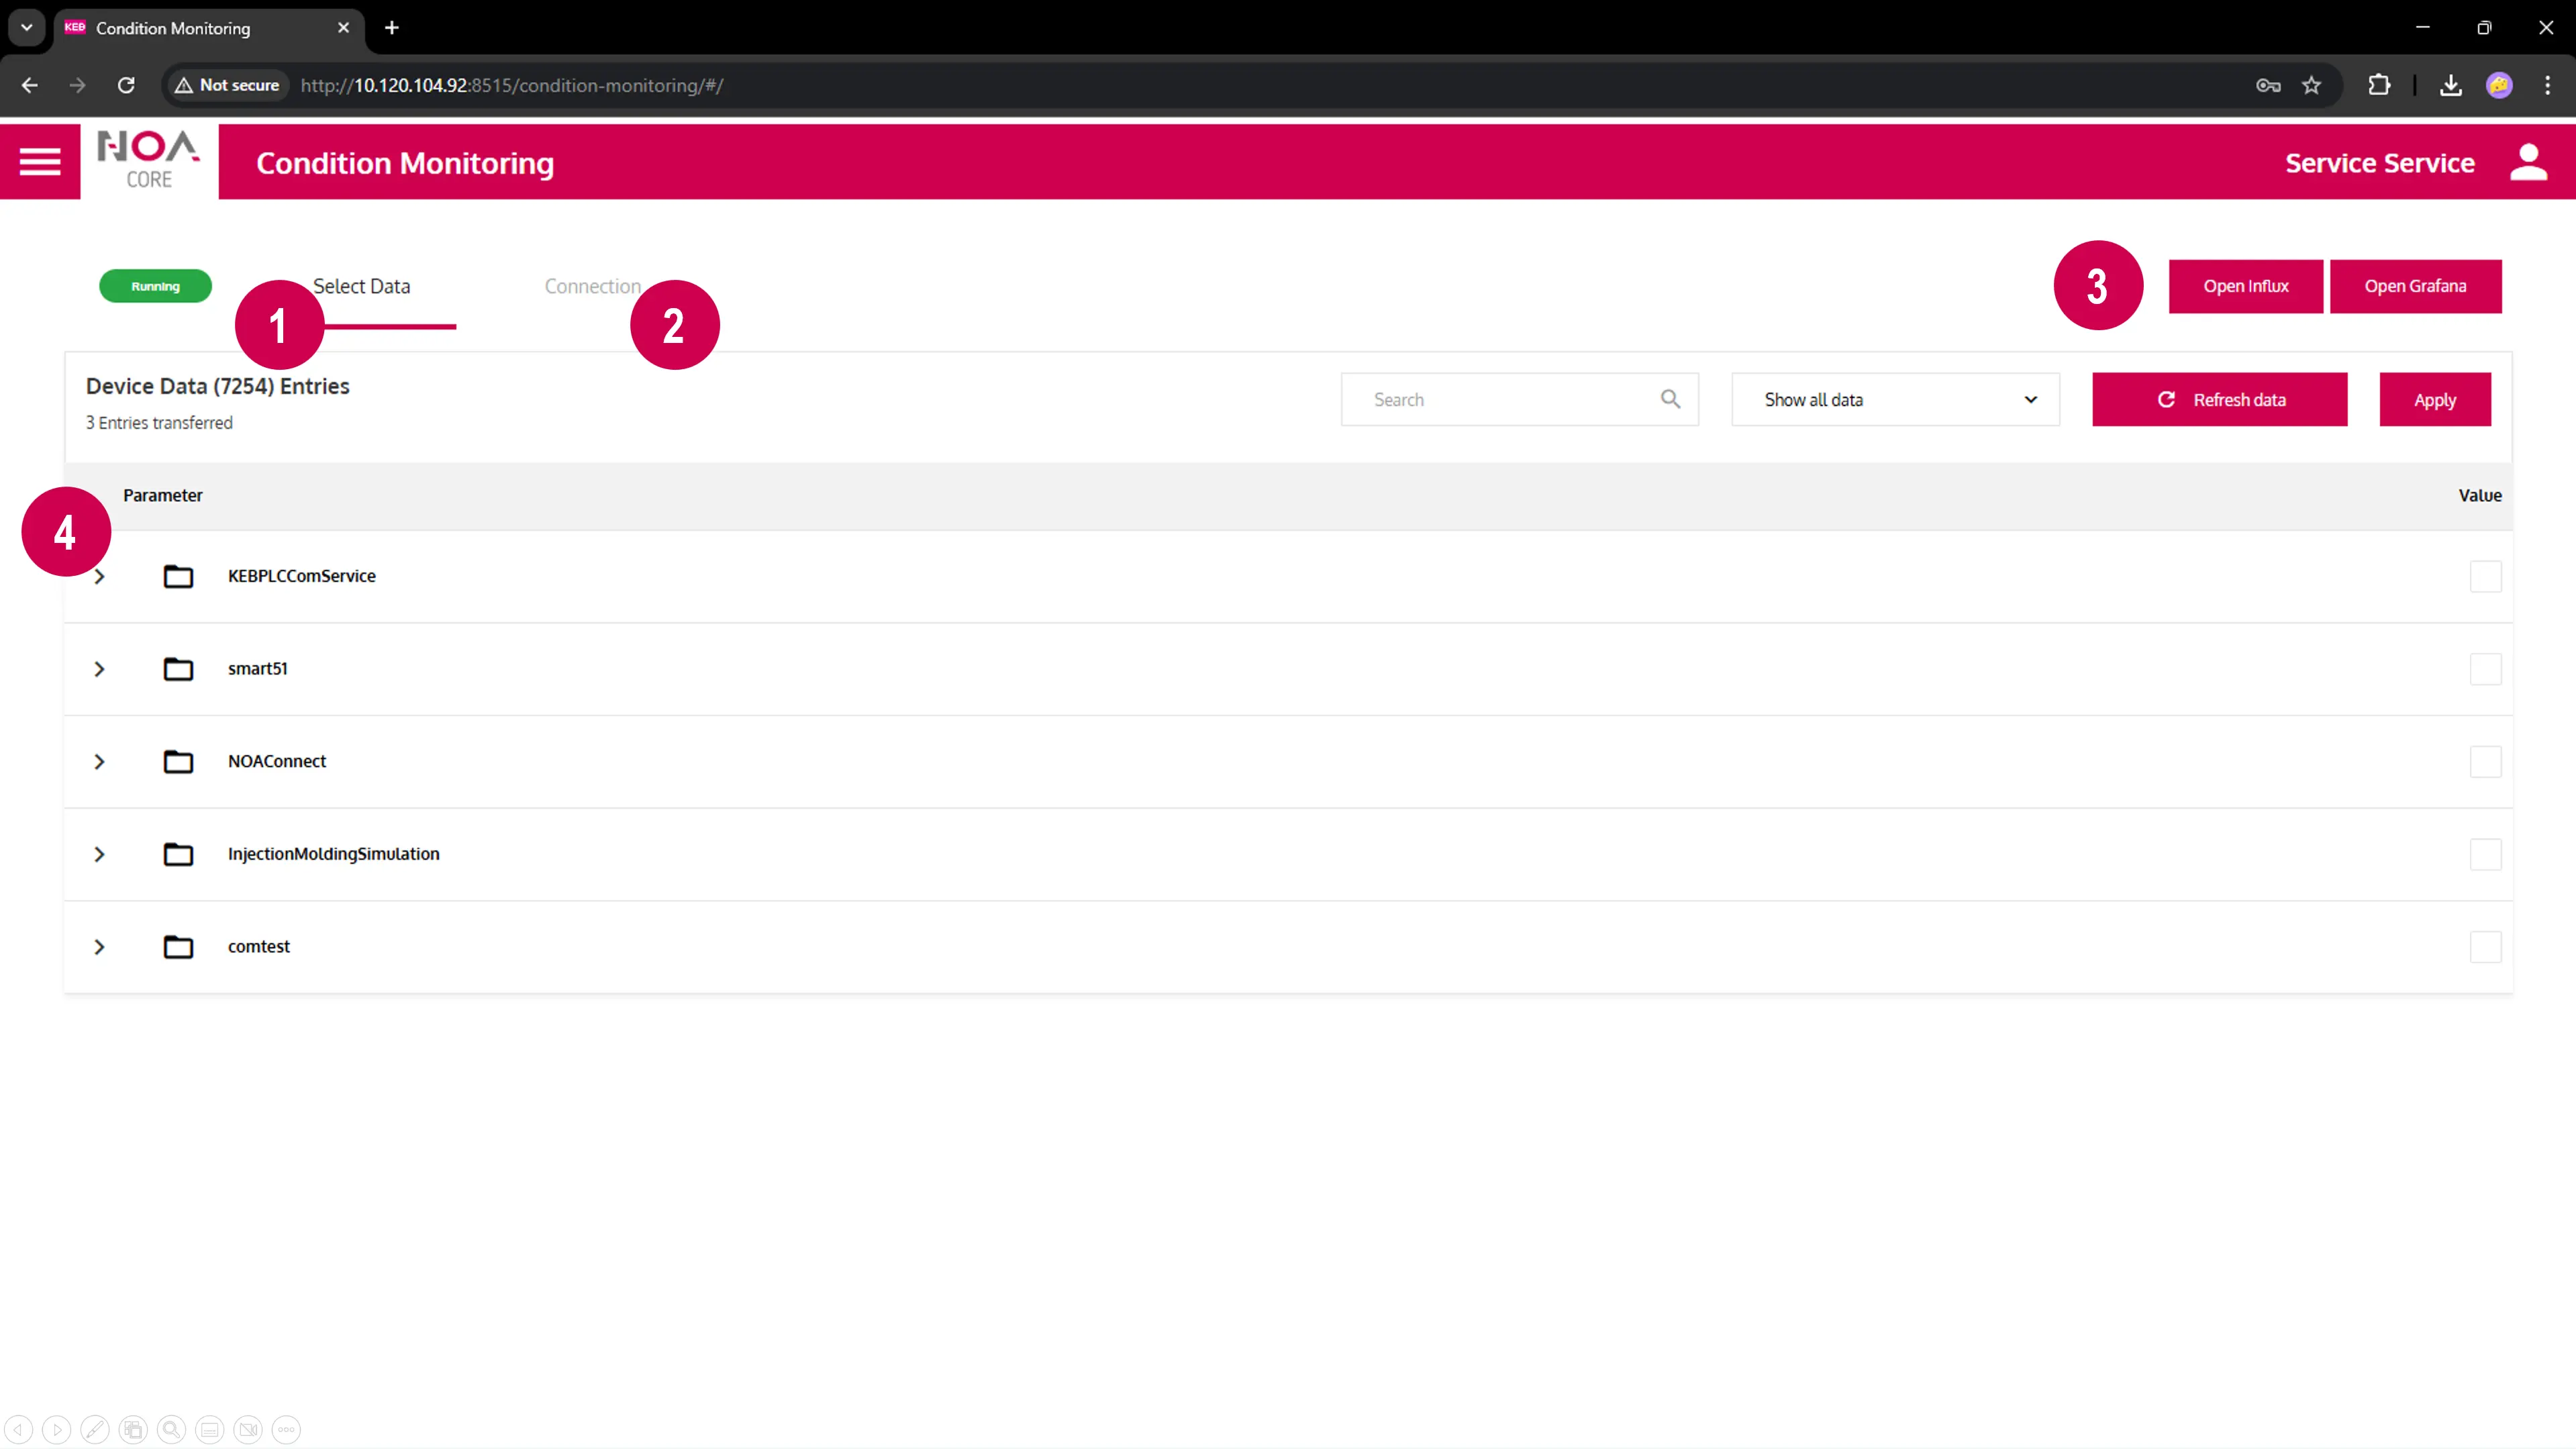
- Tab "Select Data" to define which data should be written to Influx
- Tab "Connection" to specify the target Influx database
- Open Influx and Grafana with these buttons (will open in new browser tab)
- Data Tree to select data. Press "Refresh Data" to fetch an update for available variables
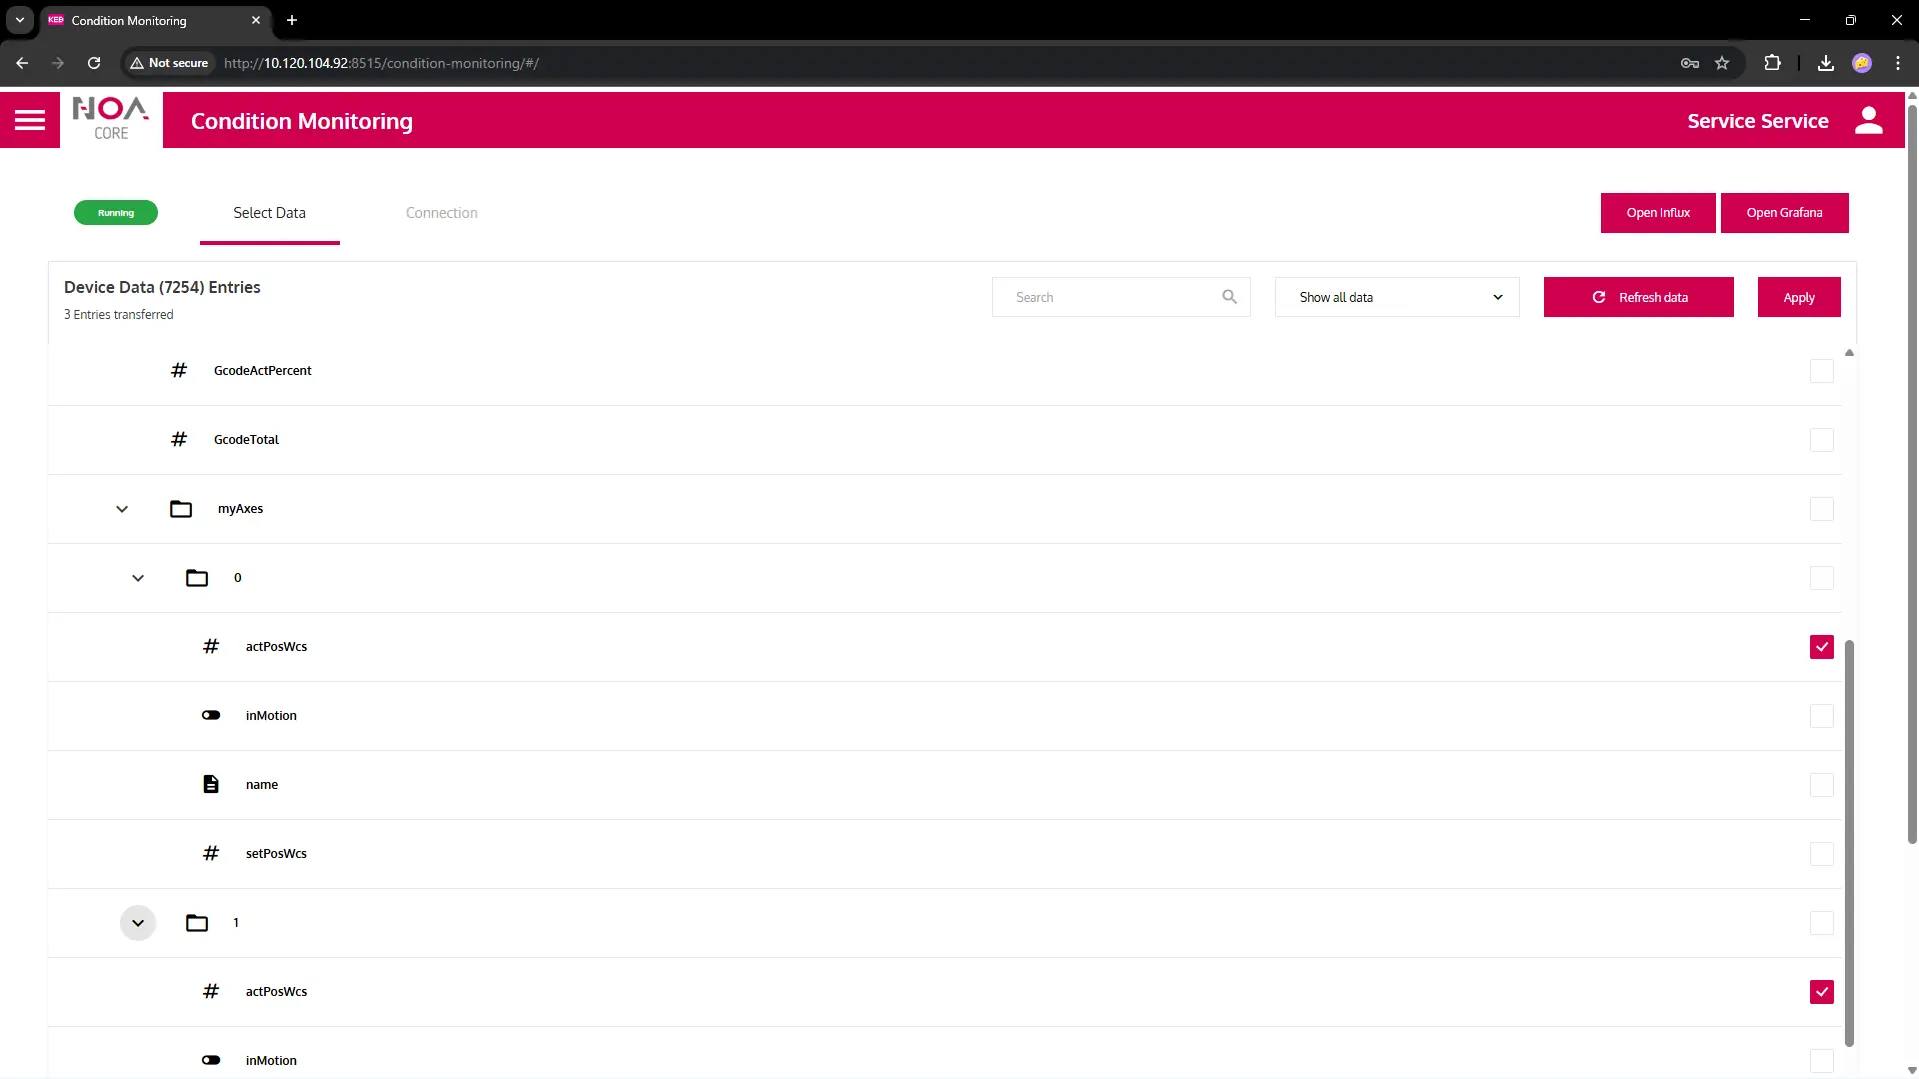
Configure Data Collection
Select Data
Select the data that should be written from Parameter tree. It will be stored in Influx.
- If no data is shown: check your Device Communication and the
- Influx Connection setting (see next step)
Configure Target Influx Database
Optional: Configure the database connection to Influx
The defaul configuration uses the local Influx database.
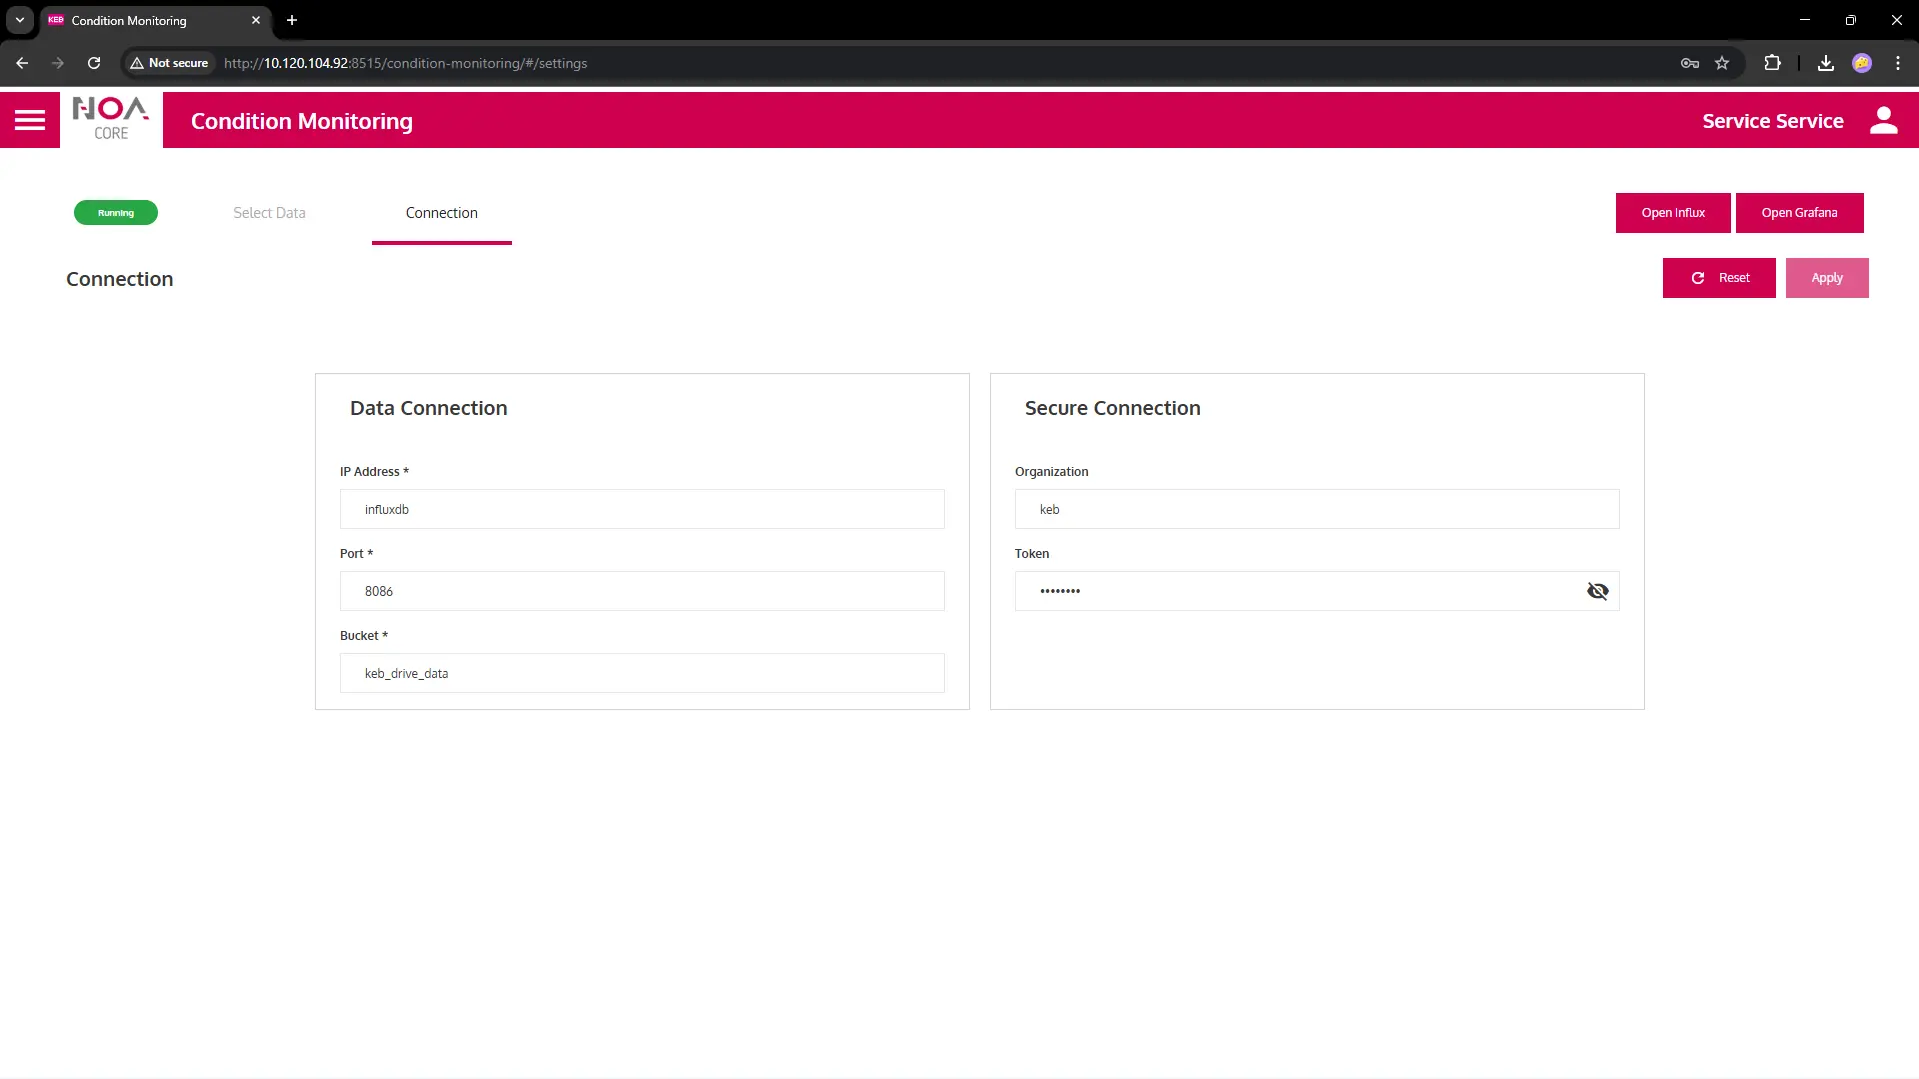
Default Settings
- IP Address of local Influx is
influxdb, remote DB e.g.10.120.104.50works, too (localhostwon't work) - Defaults: Port
8086, Bucketkeb_drive_data - Authentification
kebandmy-token(see below)
Influx Configuration
Influx is used as a database to store the time series data that is configured for the Condition Monitoring app (Influx Writer).
- Access the Influx web app
- Open the Influx app in a new tab with the corresponding button in the Condition Monitoring app.
- Use
adminandpasswordfor authentication
Data Explorer
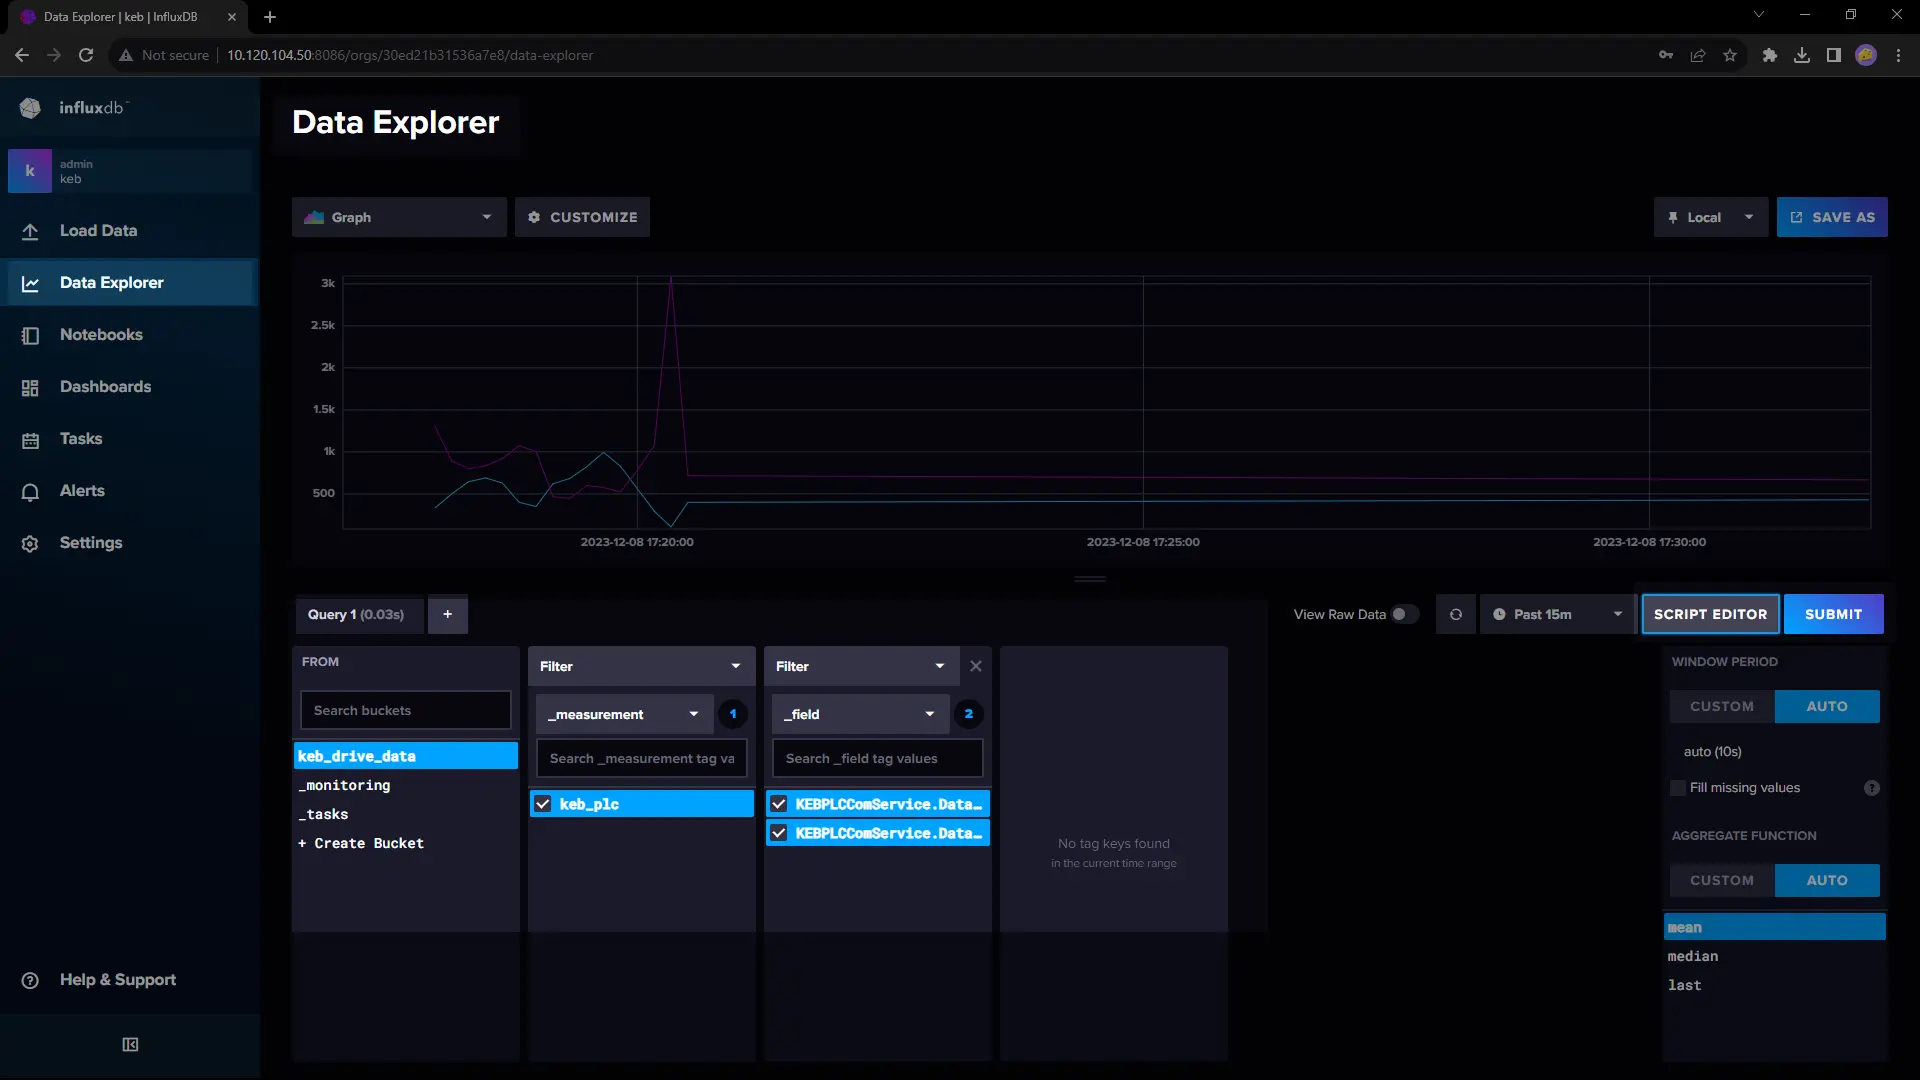
- Choose "Data Explorer" in the menu on the left
- Select the data to show below "Query1"
- Press "Submit" to see the result
- Modify Window Period to "CUSTOM" and set to
1s, Aggregate Function to "CUSTOM" and de-select "mean" - This shows a simple graph of the selected data.
- Select the time interval for which the data will be shown.
Make sure the time interval is set correctly e.g. "Past 15m" and that there is data actually available.
Check for data in the "future" (time not set correctly on device), use now-1d to now+1d to make sure
➡ (Time Settings -- /NOA-Documentation/NOA-Hardware/Time-Settings)
Script Editor
Switch to "Script Editor"
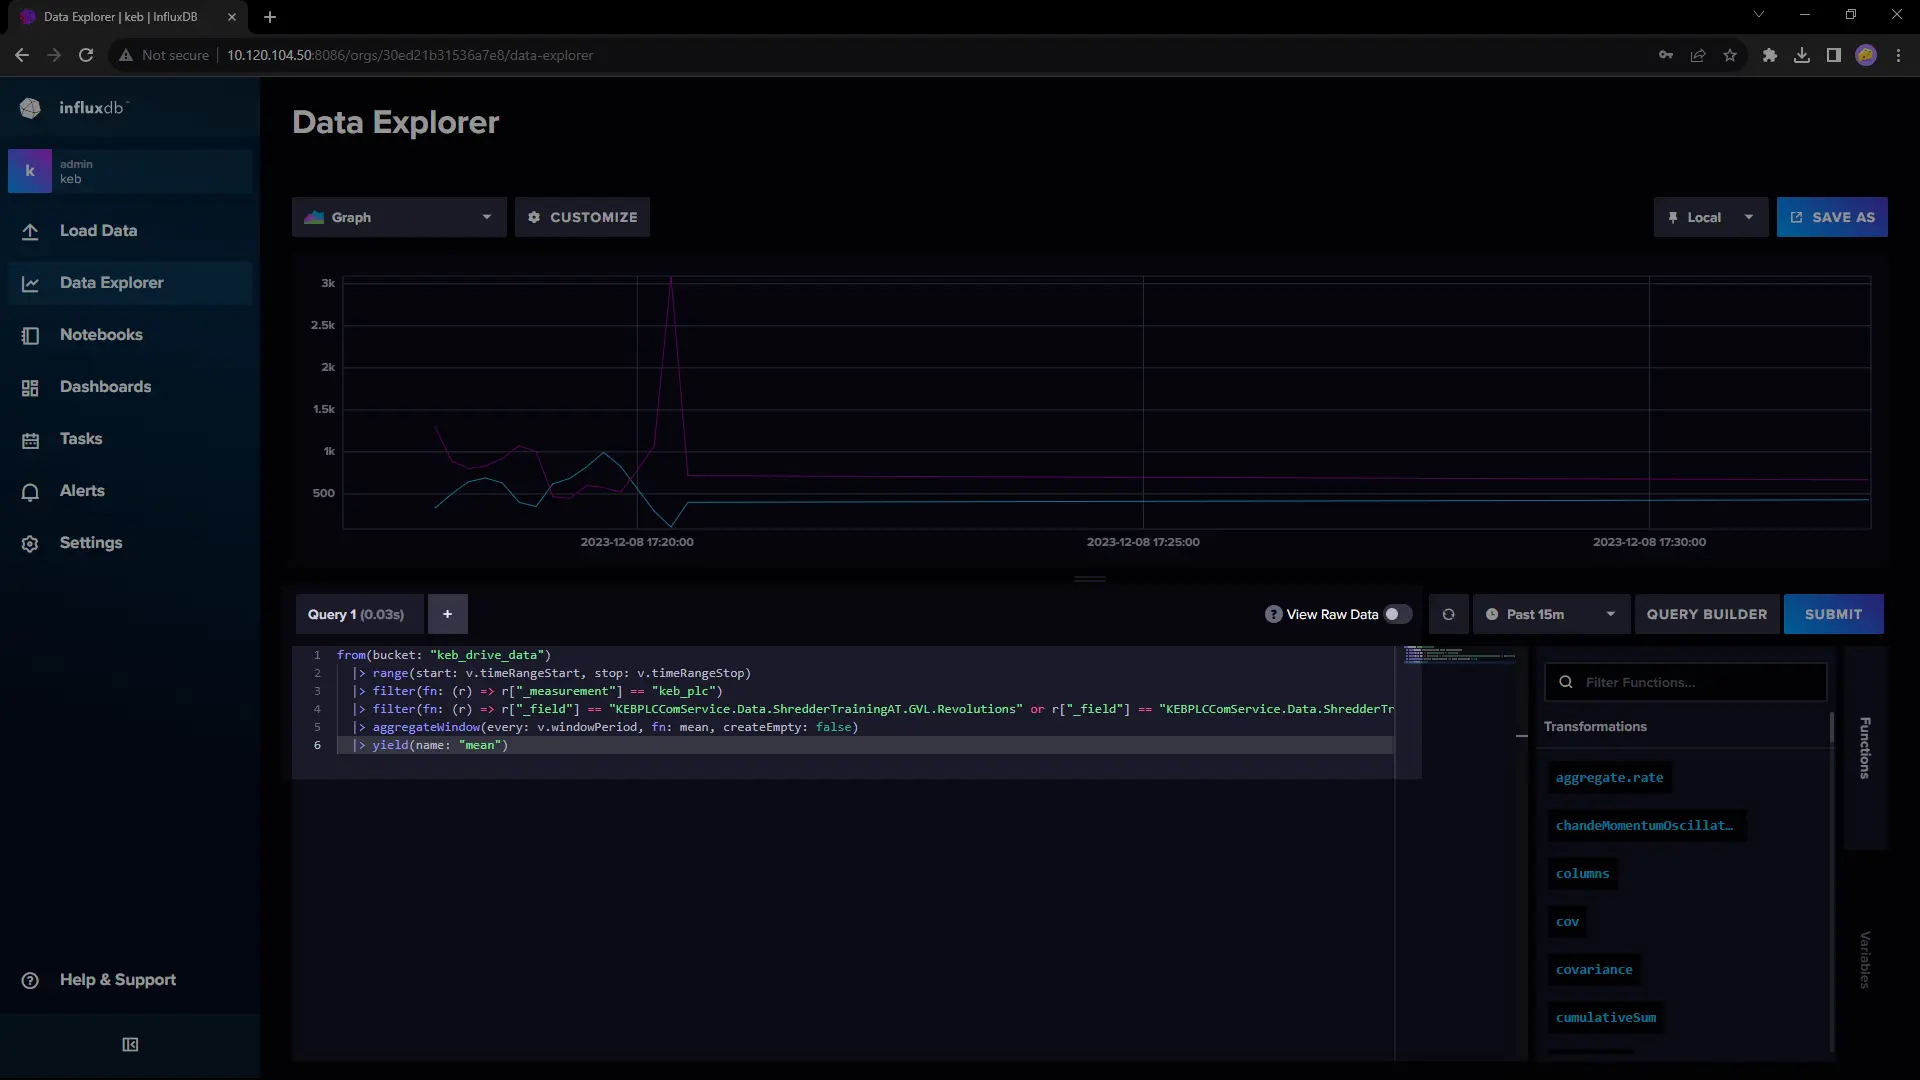
- The query "Query1" is shown as plain text
- Copy this text to the Clipboard (mark and Ctrl-C) -- insert this query into Grafana (next section)
Grafana Configuration
Grafana is used to visualise and analyse data from any source, in this case an Influx database.
- Access the Grafana web app
- Open the Influx app in a new tab with the corresponding button in the Condition Monitoring app.
- Use
adminandadminfor authentication (Choose "skip" if you don't want to alter the credentials)
Create Data Source
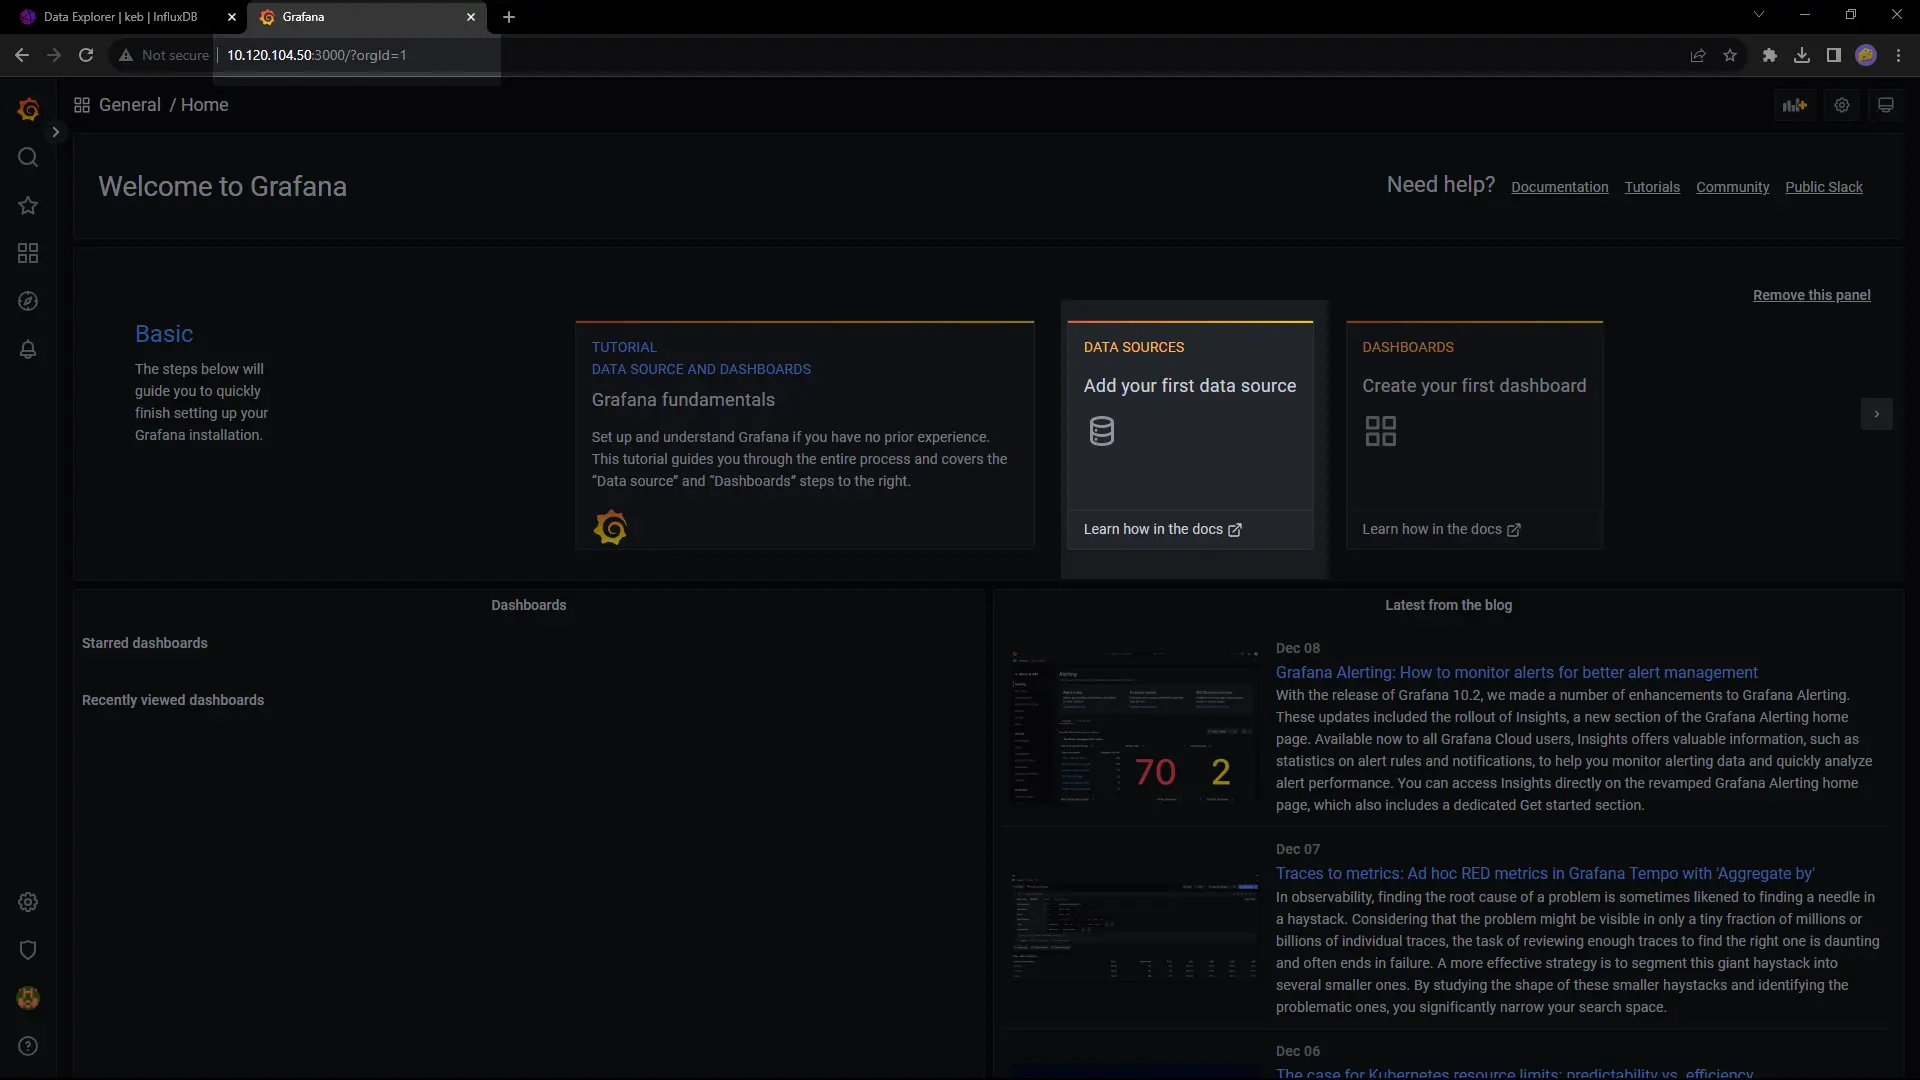
- Click "Add your first data source"
- Select "InfluxDB" in the following screen
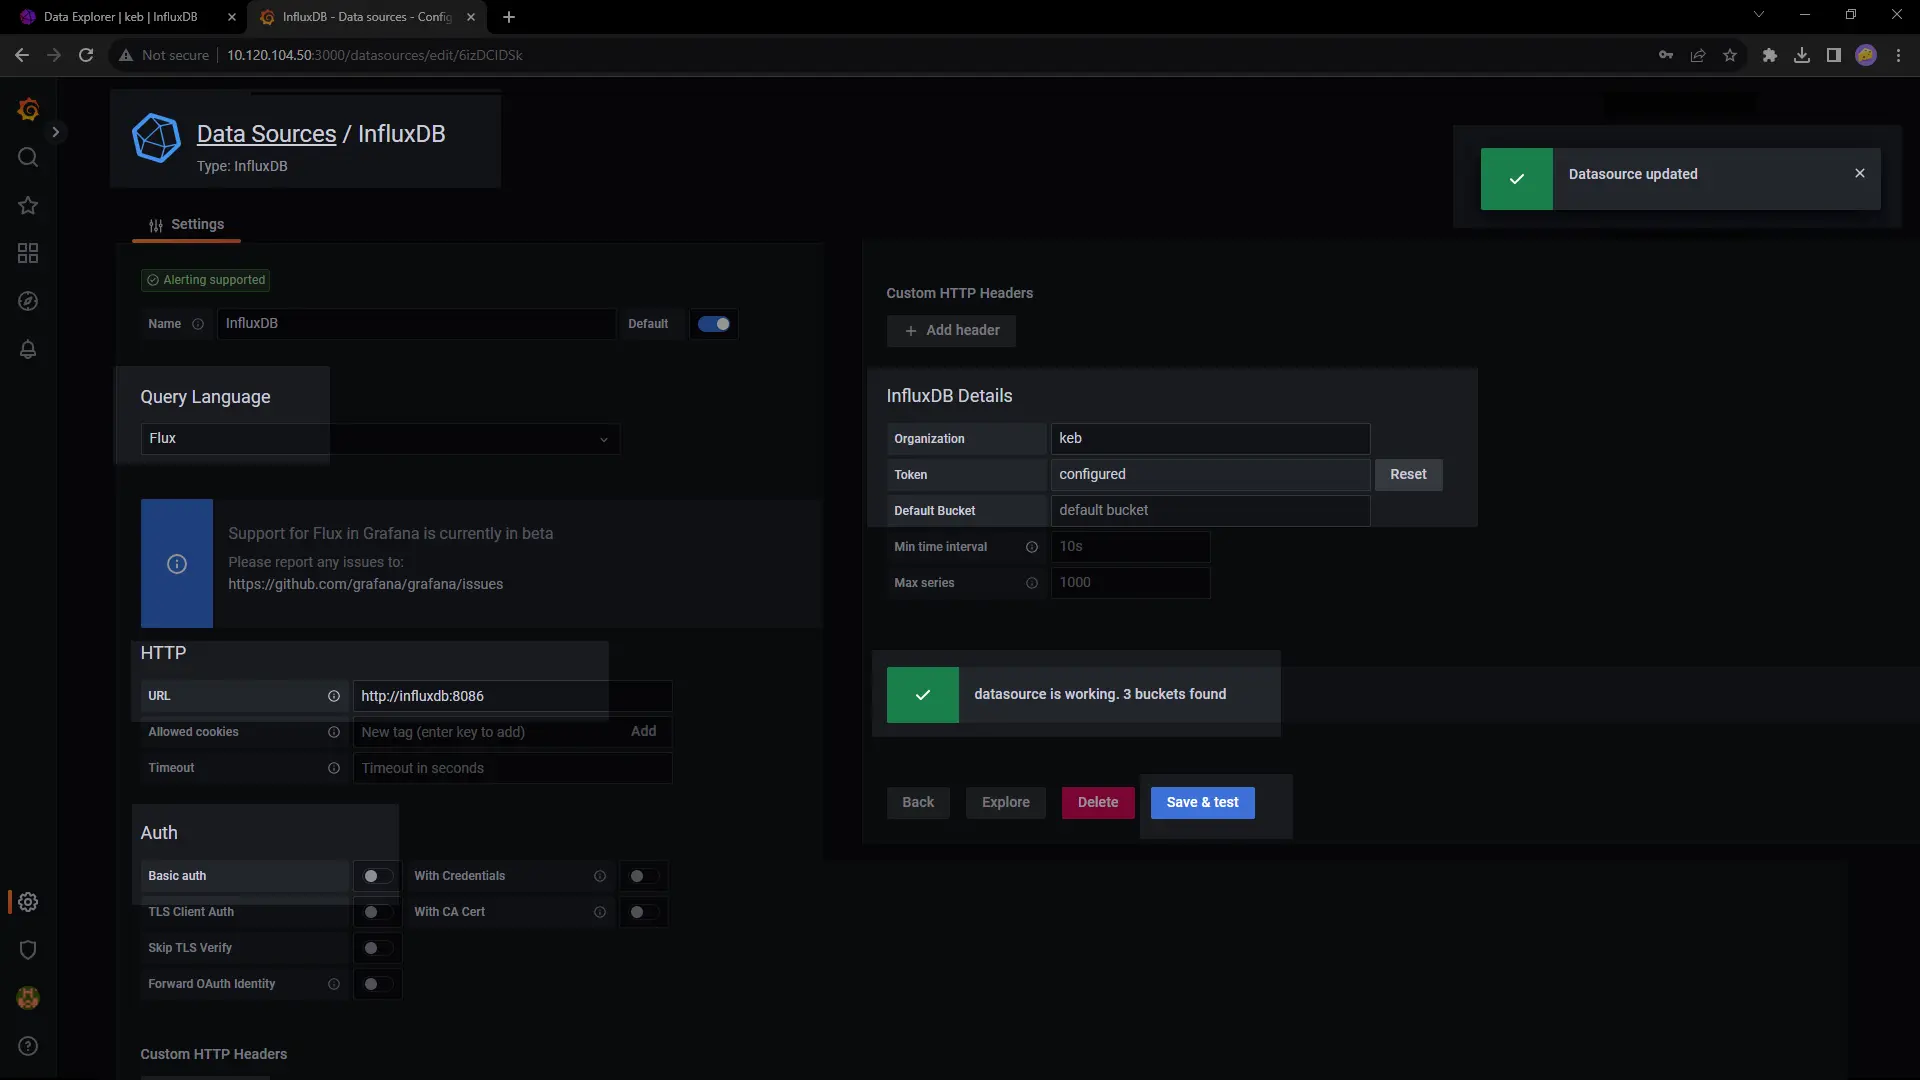
Configure Influx Source
 |
|
Set the following values
- Query Language:
Flux - HTTP URL:
http://influxdb:8086/ - Auth: De-select
Basic auth - InfluxDB Details
- Organization:
keb - Token":
my-token
- Organization:
- Press "Save & Test"
Make sure you get the settings as shown in the screenshot and a ✔ green check at the end
Create a Dashboard
Create a Dashboard with Influx Data
- Create a new dashboard from the menu on the left of the screen
- Click "Add Panel"
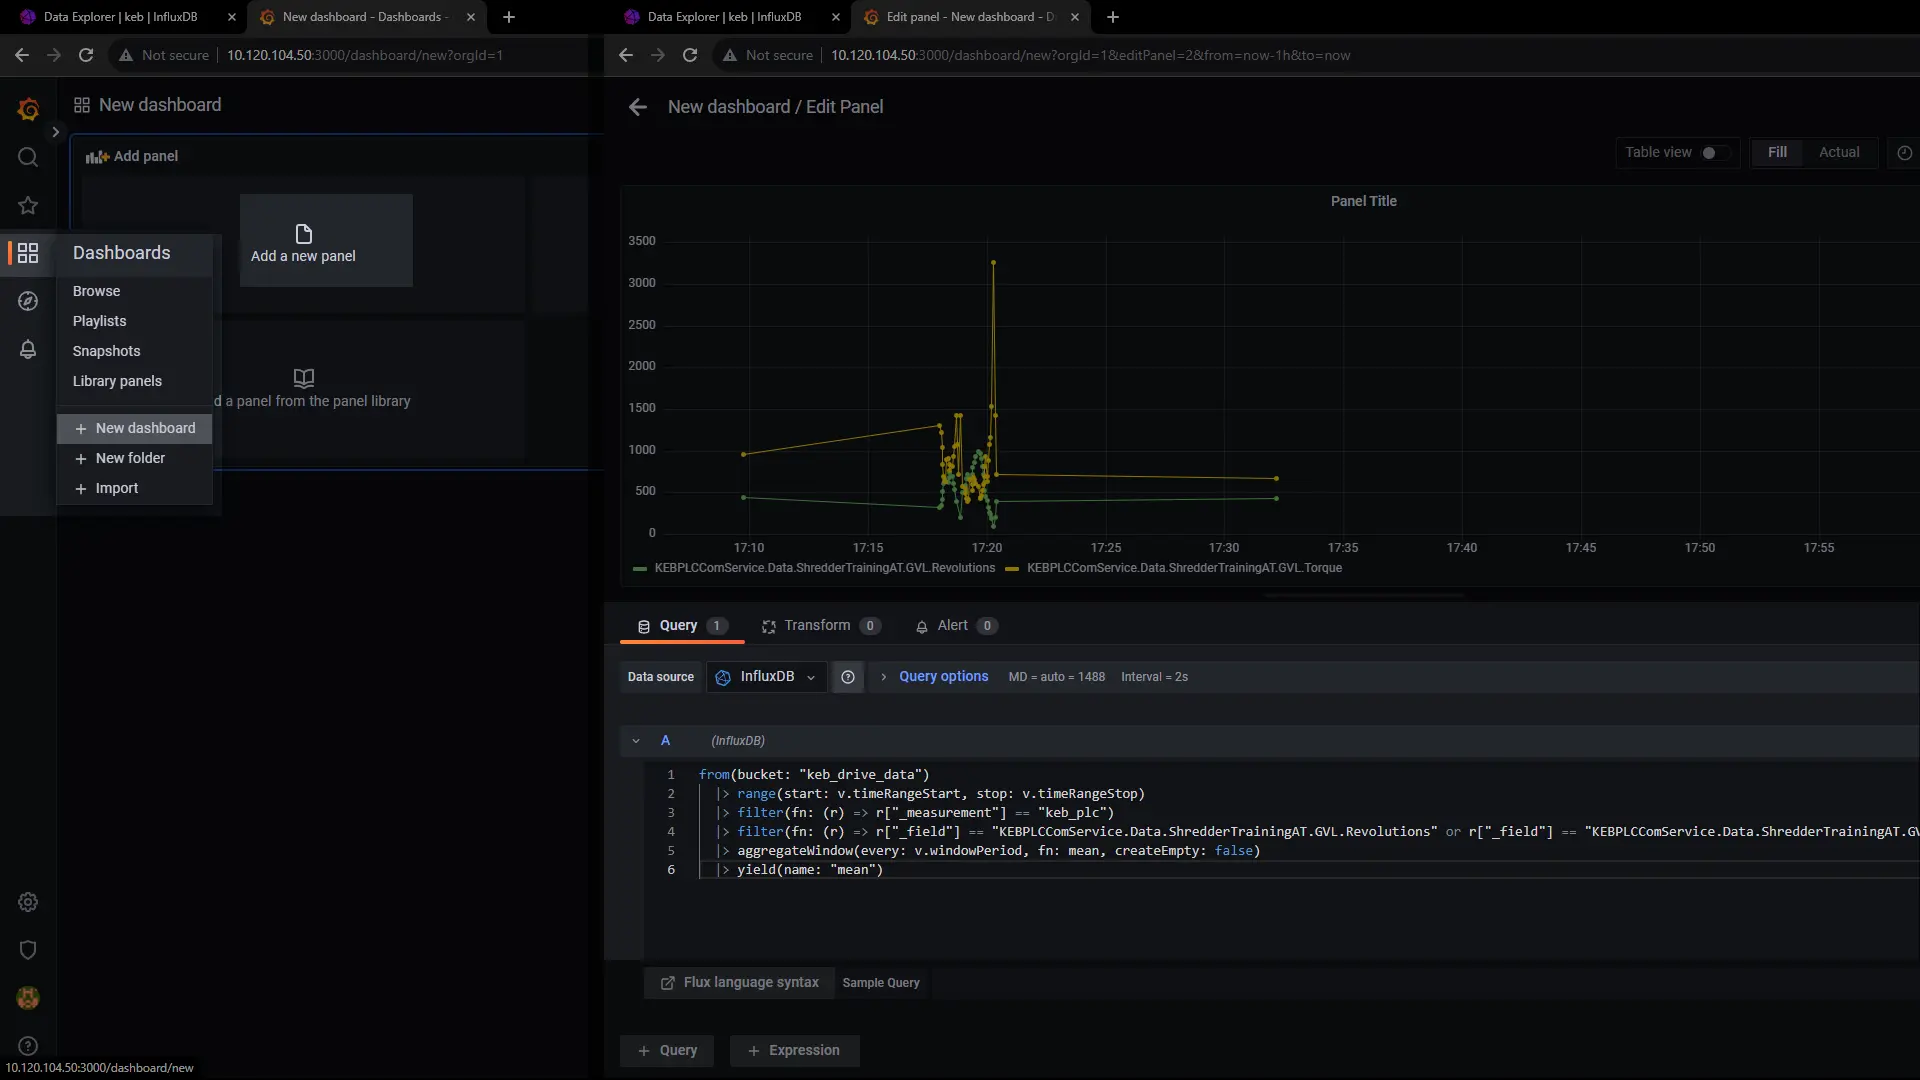
In the Edit Panel screen
- Paste the query from Influx into the text box under "A"
- Press "Apply" (upper right corner)
- Make sure your time range fits, e.g. "last 1 hour"
- If you get a warning about "Too many datapoints" try: reduce the time frame; increase "Query Options > Max data points"
💾 Save your changes! -- Click on the floppy disk icon in the Dashboard
Share Dashboard
- Click the Share icon for the dashboard right next to the title
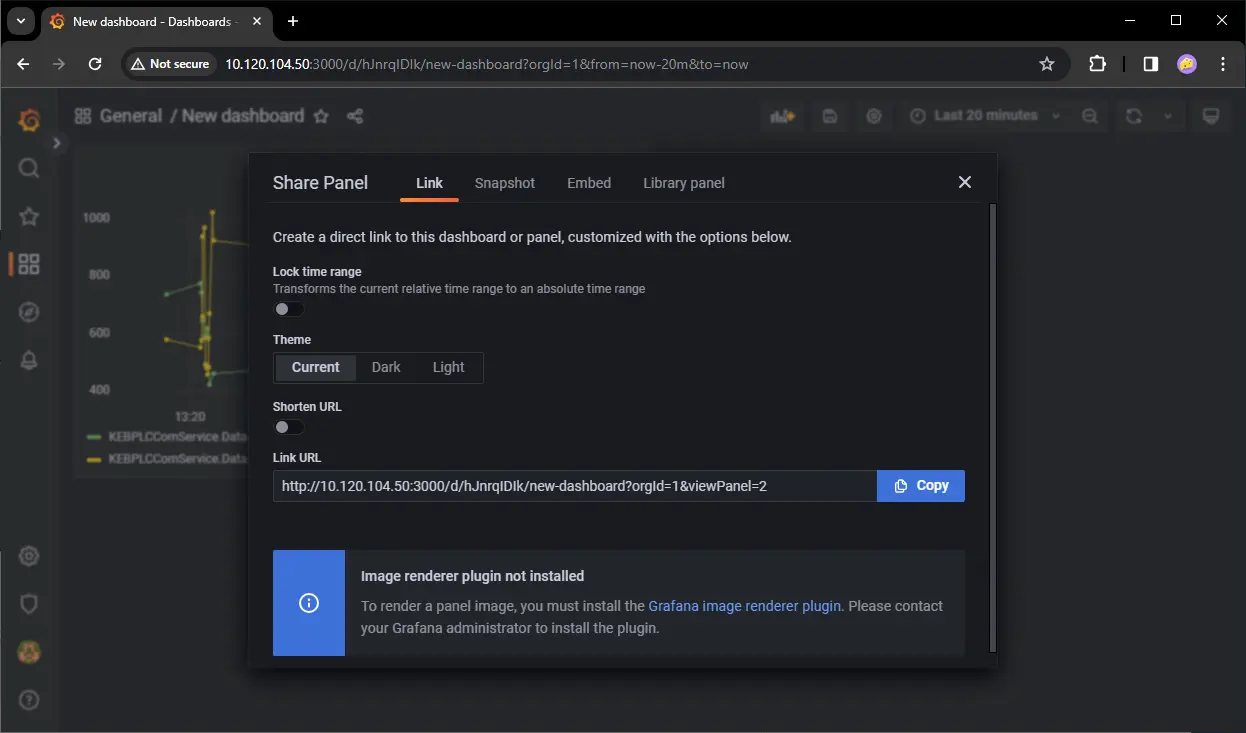
Share Panel
- Click the three-dots menu on the right in the Panel Title
- Deselect "Lock time range" in the following steps
- Get the embed link
- "Share > Share link" --> this will always leave some controls visible in HELIO
- "Share > Share embed": Copy the
srcstring, e.g.http://localhost:3000/d-solo/ef9yf38ldcq2oe/new-dashboard?orgId=1&timezone=browser&panelId=1&__feature.dashboardSceneSolo
In HELIO
- Paste the URL into an Embedded Webview Page and/or an Embedded Webview inside a Widget on a Dashboard Page ➡ see next section
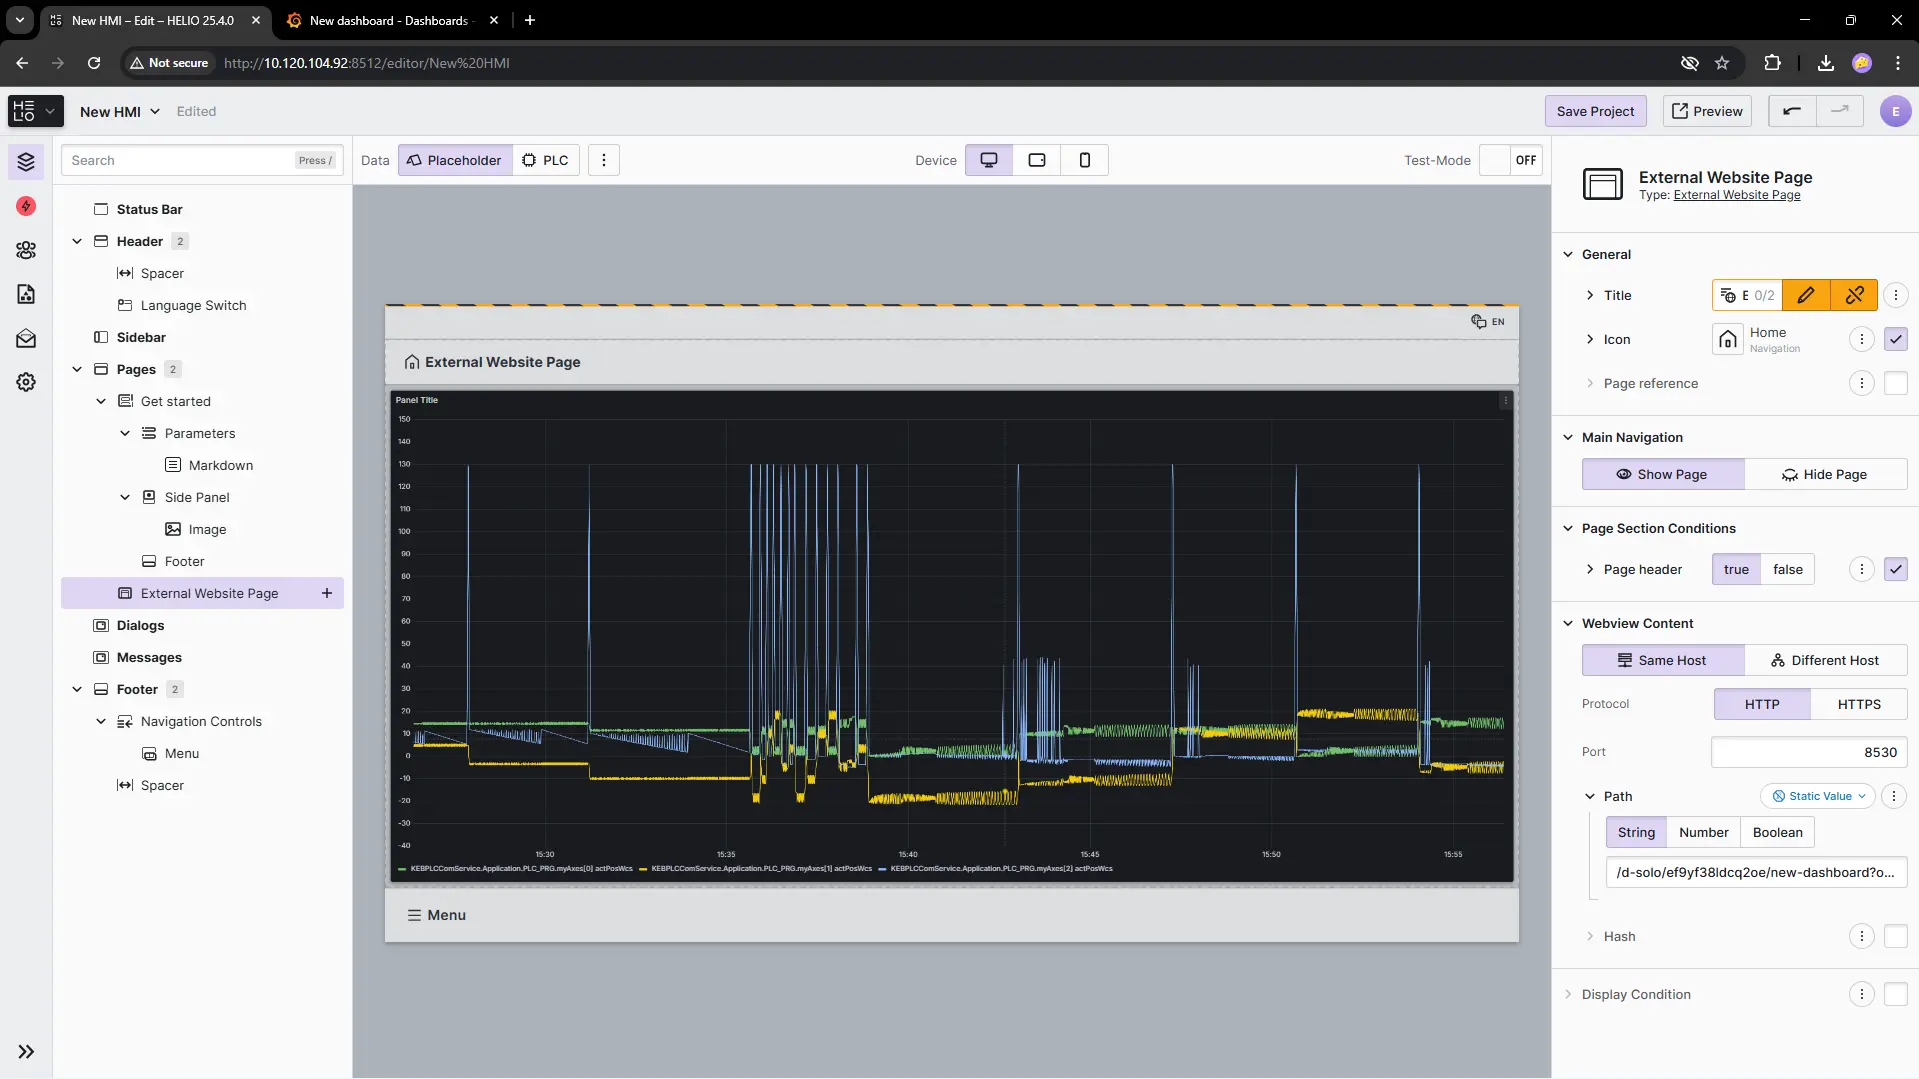
Embed in HELIO HMI
URL Example as copied from Grafana
http://localhost:3000/d-solo/ef9yf38ldcq2oe/new-dashboard?orgId=1&timezone=browser&panelId=1&__feature.dashboardSceneSolo
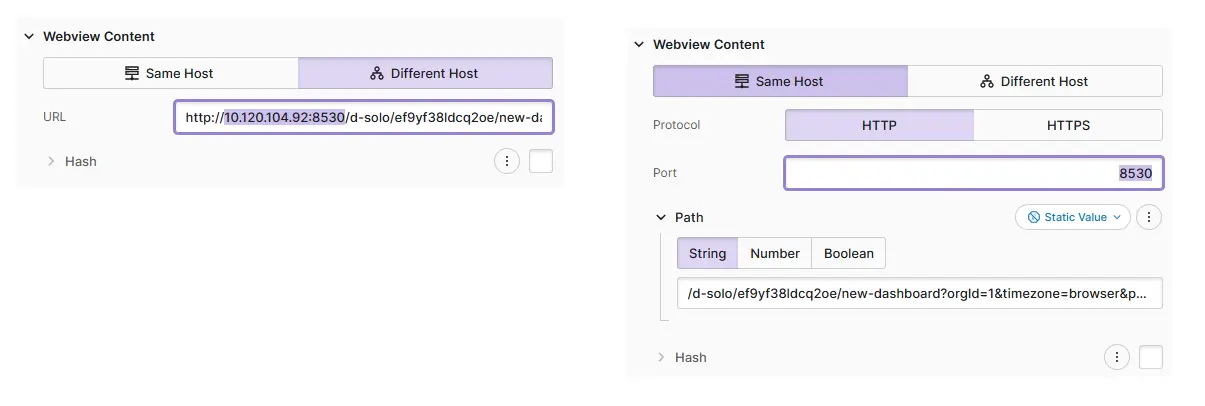
Use Embedded Webview (Page)
Insert the resulting URL into an Embedded Webview in HELIO
First use the complete URL, then
- Switch to "Same Host"
- Change port from
3000to8530❗ - If you want to use "Different Host" replace
localhostwith the actual ip address
Adapt URL
- Add parameters for your use case at the end of the URL &from=now-1h &to=now &kiosk &refresh=5s
- To adapt the shown time range change the values for
fromandtoparameters in URL- Date+time is in ms, you may use relative times, e.g.
nowandnow-1d.
- Date+time is in ms, you may use relative times, e.g.
- Add
kioskto the end of the URL to disable most of the Grafana UI. - Add
refresh=5sto keep the dashboard updated (specify the interval)
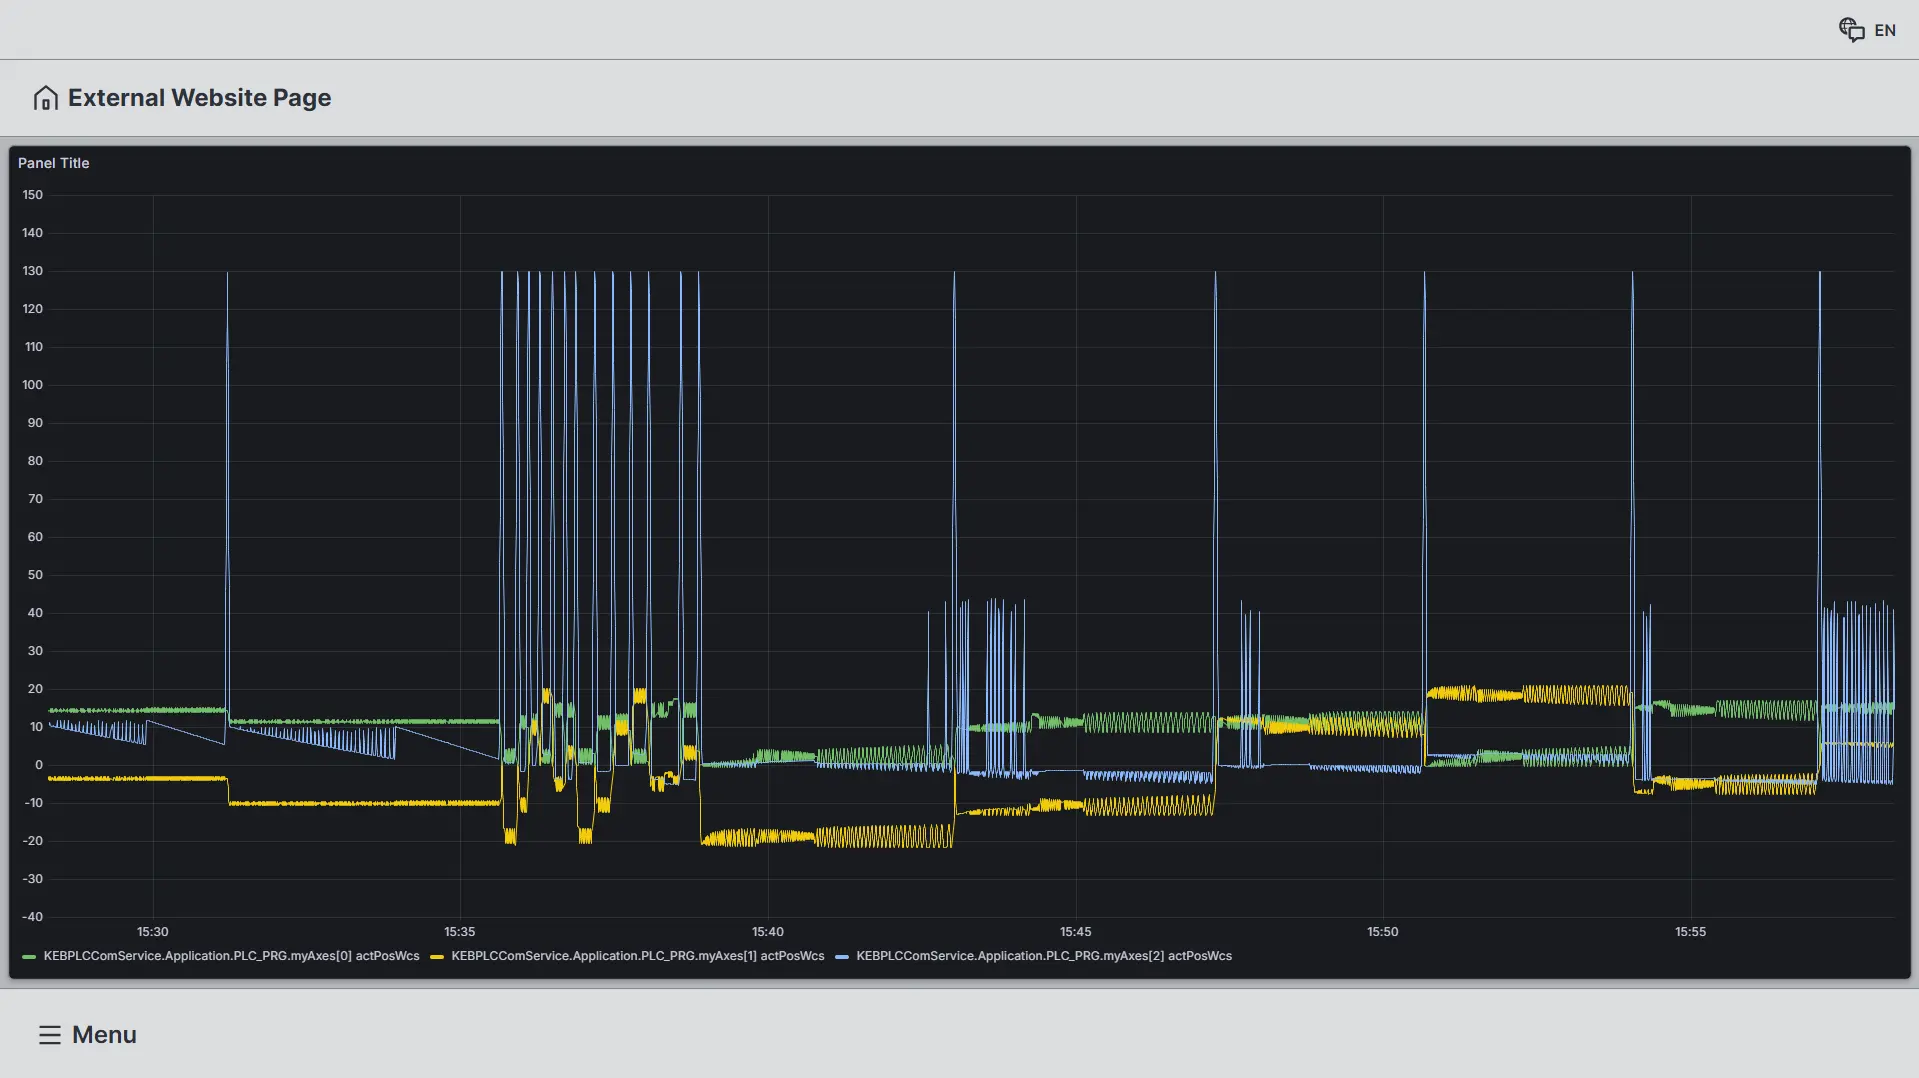
Result
Known Issues
- SOLVED: Cannot install Condition Monitoring on C6X1 Panels: The panel uses the same port as Grafana
:3000for the system settings- Port changed to
8530see above
- Port changed to